

Horticulture

Horticulture
-
Output $1,729m est. up 1% yoy
-
Demand from Asia continues to drive export growth
-

Nuts are the largest horticultural export market by value
Industry momentum in 2018–19 was driven by unprecedented demand from Asia, favourable commodity outlooks, new capital, and new technologies. The vast number and range of commodities produced by the sector continued to grow, with production shifting to accommodate significant increases in apricots, avocados, sweet corn, cauliflower and turf.
At the date of publication, detailed industry information is not available, consequently the following production and price commentary analyses 2017–18 industry data.
Cherries into China
NSW DPI, in collaboration with the Australian Government and China market teams, has enabled NSW cherries to be air-freighted to China within four days of harvest.
NSW DPI supported amendments to import air freight protocols for the regulated China market by addressing technical issues and scientific requirements, and providing ongoing innovation and on-farm research.
Learn More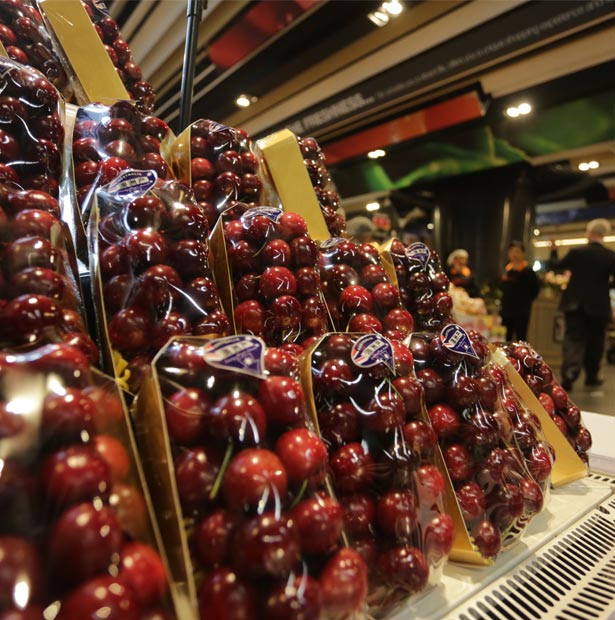
Establishing a citrus industry in north west NSW
NSW DPI is continuing to assist in the establishment of a viable fresh market citrus industry in north west NSW. Grafting the popular Afourer mandarin onto established root systems of a number of juicing varieties should see fruit available for quality assessment in 2-3 years. The variety is hoped to fruit earlier than the southern regions and have good sweetness to increase export potential to markets such as China.
Learn More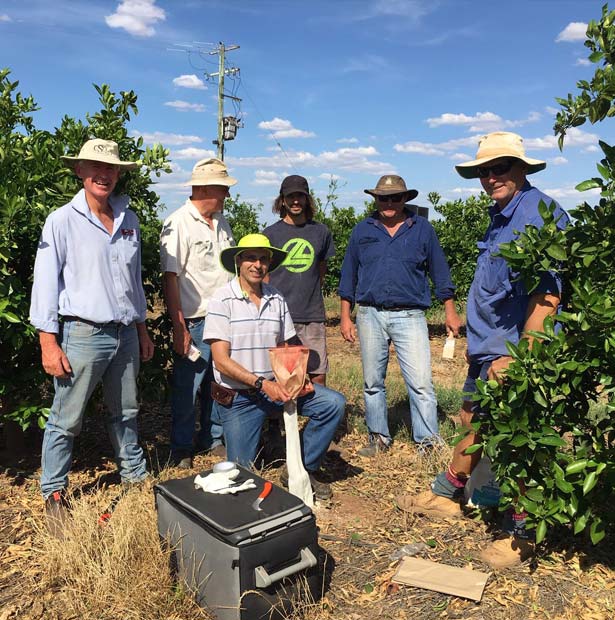
Help for blueberry farmers to manage disease
NSW DPI researchers are investigating Botryosphaeriales – an order of fungi that cause stem blight and dieback in blueberry plants. Some farmers are facing reduced revenue as infection rates up to 10% increase plant mortality and associated costs. The research is being used to help understand the geographic distribution of Botryosphaeriales species, and offers valuable information for plant pathologists and growers trying to manage the disease.
Learn More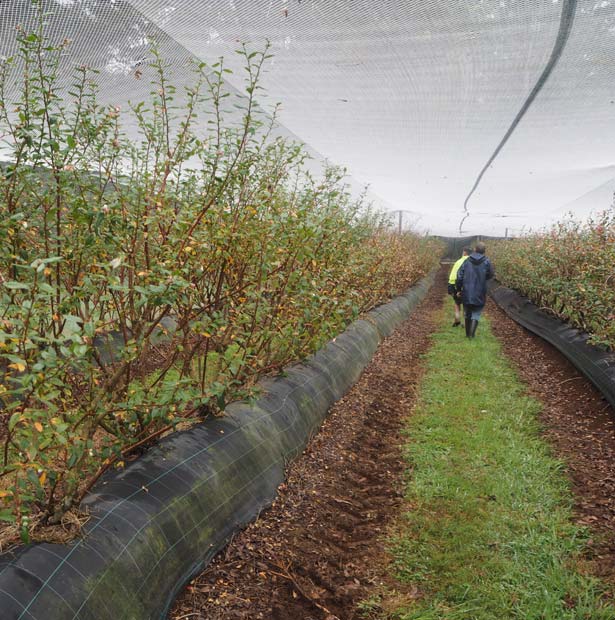
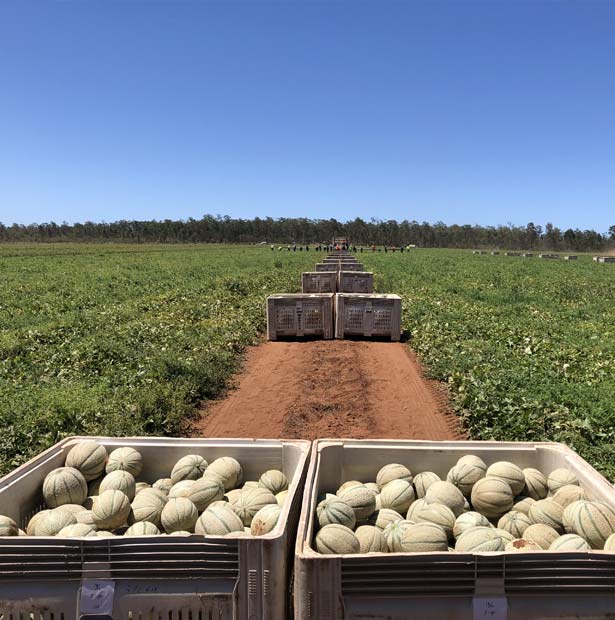
Protecting and growing our rockmelon Industry
NSW DPI has worked with melon growers throughout Australia to understand and implement microbial testing procedures in post-harvest facilities since the 2018 listeria outbreak impacted the industry. NSW DPI held workshops with melon growers and other industry representatives to highlight awareness of external threats to food safety in the rockmelon industry and strategies to implement better control measures.
Exercise Orange Juice
NSW DPI, in partnership with Local Land Services and key citrus industry stakeholders, conducted an exercise designed to review and evaluate NSW preparedness to respond to a detection of the exotic disease citrus canker. Citrus canker has been detected in the Northern Territory and Western Australia. Although never detected in NSW, the NSW Government identified a need to review and evaluate emergency response plans, preparedness and response capacity.
Learn More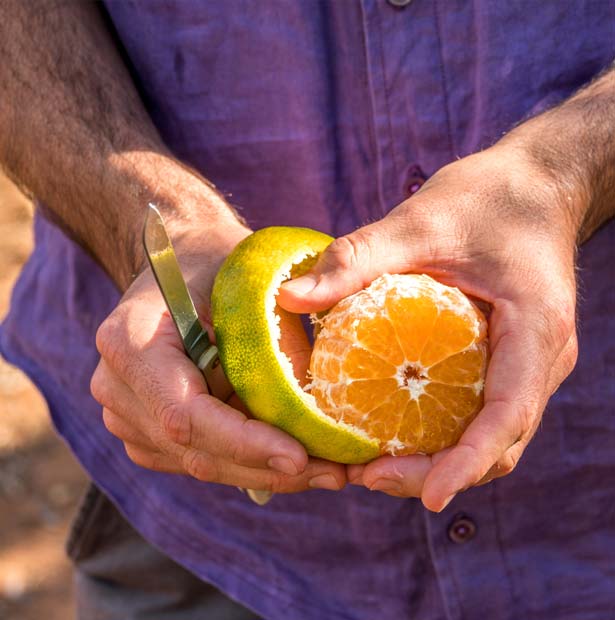
Horticulture Overview
Horticulture Output in 2018–19 equated to $1,729 million. The area dedicated to production increased 5% year-on-year to 96,251 hectares18.
Growing conditions in 2017–18 were characterised by above average temperatures and a very mild winter. Rainfall at the start of summer was well above average in south-eastern parts of the state. However by the end of summer, conditions had begun to deteriorate with declining soil moisture levels and reduced availability of water for irrigation.
The value of horticultural exports for 2018–19 experienced year-on-year growth to reach $458 million, partly driven by increased export volumes. Asia continued to be the main destination, with 65% of all exports by value arriving in these markets. Total horticultural exports to China grew 56% in value to $102 million – the first time more than $100 million. Exports to Japan grew 45% to $57 million and the Singapore market saw 29% growth to $22 million87.

Output 2017-18
Download (.XLSX) Source: ABS (2019b)-
 Nurseries, Cut Flowers & Turf
 - Nurseries
- Cultivated turf
- Cut flowers
-
 Vegetables
- Mushrooms
- Potatoes
- Melons
- Other Vegetables
-
 Fruit & Nuts
 - Oranges
- Avocados
- Table grapes
-
Other Fruit
(Excl. wine grapes) - Macadamias
- Almonds
- Other nuts
Nuts
Nut production totaled 29,580af tonnes in 2017–18, up 10% year-on-year88. Almonds were the largest single nut industry by quantity, producing 9,288 tonnes, up 8% year-on-year, while macadamias were the most valuable nut industry, producing 7,484 tonnes at a value of $93 million88, 17. As orchards matured, the majority of nut varieties saw small year-on-year increases. Efficiencies of scale were generated as plantings were expanded by both established growers and new industry entrants.
Despite the relatively small year-on-year increase in total production, the potential production capacity of the industry continues to magnify. The expansion of the almond industry is particularly notable with 77% of the 3,426,417 trees not yet of bearing age. This is equivalent to at least an additional 23,000 tonnes of almonds, up 337% on 2017–18 production levels18.
Nuts remained the largest horticultural export market by value in 2018–19, increasing 25% year-on-year to $241 million87, largely due to higher prices and improvements in market access. The majority of the growth in value continued to come from China, assisted by the ChAFTA elimination of the 10 to 25% tariff on all nuts on 1 January 2019. Exports to Japan also saw very positive growth with a 49% year-on-year increase in value87. Although domestic consumption increased, with 3.1kg of nuts supplied per capita88, the majority of demand came from international markets.
The main factor driving global consumption growth continues to be increasing public health consciousness. One sector contributing to this escalating demand is the milk alternatives market. It has been estimated that the global dairy alternatives market will reach upwards of USD $37.5 billion by 2024, driven by demand from a growing vegetarian and vegan population116. Domestic sales of almond milk have been progressively increasing year-on-year, and accounted for 35% of the total non-dairy milk alternatives supermarket sales nationally in 2018 (non-dairy milk alternatives accounted for 7.9% of total supermarket milk sales by volume and 12.4% by value in 2018)42.
Nut production
- 2014-15
- 2017-18
- ISWE - In-Shell Weight Equivalent
KWE - Kernel Weight Equivalent
Production potential of the nut industry
- Trees of bearing age
- Trees not yet of bearing age
Sydney and national fruit and veg CPI
- Sydney Vegetable CPI
- Sydney Fruit CPI
- National Vegetable CPI
- National Fruit CPI
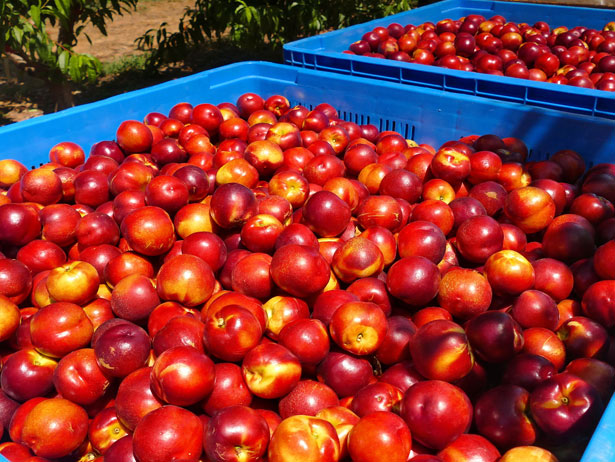
Fruit
NSW produced 492,746 tonnes of fruit in 2017–18, up 2% year-on-year88. Oranges remained the largest single fruit industry by quantity and value, producing 268,068 tonnes at a value of $143 million88, 17.
Sydney consumer price indices for fruit remained steady16.
Fresh fruit exports from NSW for 2018–19 were sent to a wide range of destinations, and totaled $106 million, or 46,000 tonnes, up by an astounding 23% year-on-year87. Improved market access into China and increased demand for fresh Australian produce drove growth, with exports to China up 99% in value year-on-year. Oranges accounted for 91% of the total fresh fruit volume exported to China.
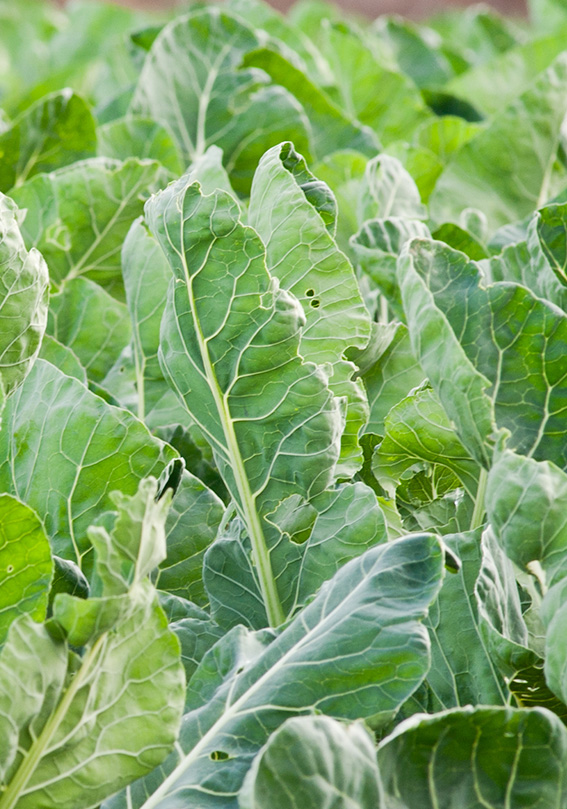
Vegetables
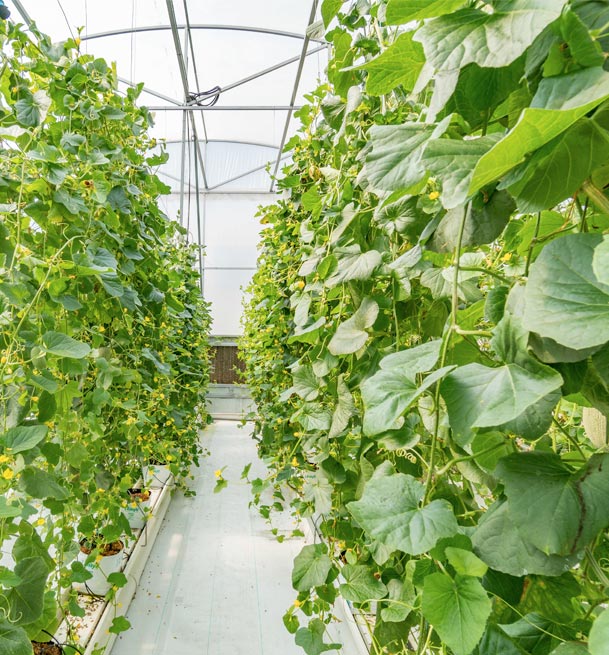
In 2017–18, vegetable growers produced a wide range of crops, with more than 33 individual commodities. Total fresh production increased 1.7% year-on-year to 317,534 tonnes88, mainly due to an increase in the area planted (16,032 hectares) and a bumper spring harvest18. Of these vegetables, 89% were grown outdoors, 9% undercover, and 3% in hydroponic systems2.
Supply was very strong for sweet corn, head lettuce, and cauliflowers, up 143%, 57%, and 21% respectively year-on-year88. Of the national supply, NSW produced 31% of mushrooms and 43% of leafy Asian vegetables (pak choy, bok choy, wombok etc), due to a comparatively longer growing season than other states.
Sydney consumer price indices for vegetables fell by an average nominal rate of 9% year-on-year, only slightly more than the national average of 7%16. Prices dipped due to exceptional growing conditions and increased supply.
The value of fresh vegetable exports for 2018–19 increased 3% year-on-year, due in part to strong growth in the key export markets of Singapore, Thailand and Malaysia, and an increase in the total volume of exports87. Singapore is the largest and most valuable export market for vegetables, worth $6.2m in 2018–19, an increase of 15% year-on-year.
Nursery, Cut Flowers
and Turf
Robust growth in demand for greenlife and increased grower confidence112 resulted in an increase in the area dedicated to nursery production (live plants grown for landscaping, revegetation, retail supply and starter plants for commercial fruit, vegetable and forestry production), up 9% year-on-year to 1,057 hectares in 2017-1818. Despite this increase in area, the value of production declined 4% year-on-year17.
The area dedicated to cut flower production almost doubled, up 90% year-on-year in 2017–1818. This was due to a massive increase in outdoor field production as opposed to undercover, most likely related to the demand for Australian native flowers. The value of outdoor production rose 262% year-on-year17.
NSW is a net importer of fresh cut flowers, importing $26 million but only exporting $0.2 million of product in 2018–1987. The demand for Australian native flowers and foliage is growing90 due to their popularity for use in sculptural pieces. Export prices for native flowers were more buoyant than the local market with some flowers selling for up to 10 times more for a single stem. Intense competition from other global suppliers generated concern for our ability to maintain supply, with new plantings requiring time to establish product volumes10.
NSW (incl. ACT) produced an estimated 13.74 million metres square of turf in 2017–18, up 9% year-on-year89. Buffalo and Kikuyu were the most common variety grown, accounting for 77% of total production. Demand growth has been hindered somewhat in recent years by the growth in high-density living and competition from artificial turf products.
