June 2024
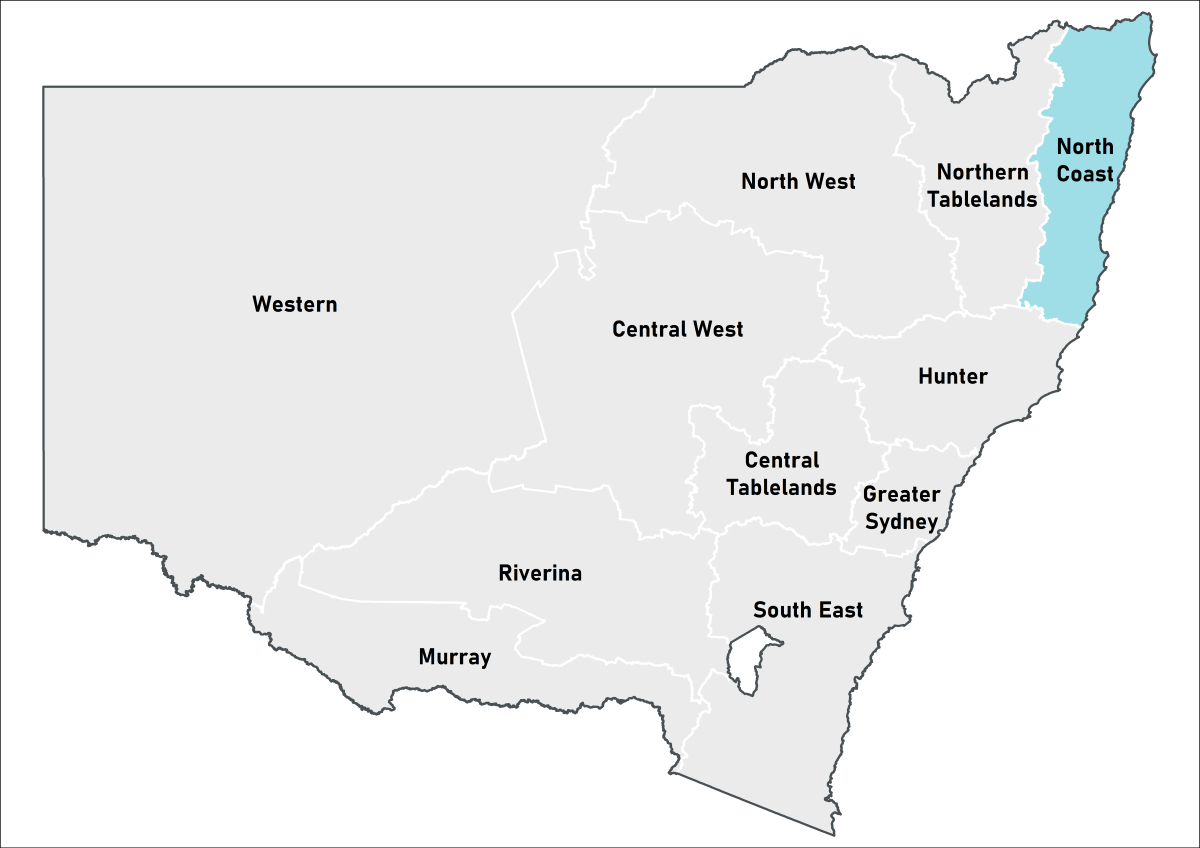 North Coast Local Land Services
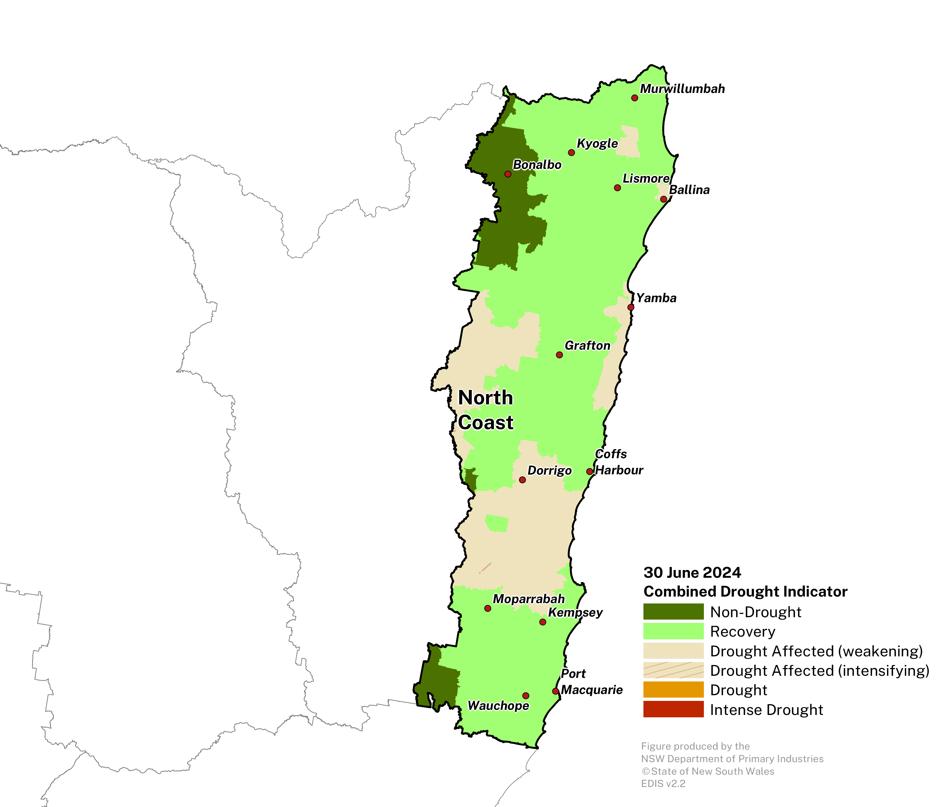
On-ground conditions continue to improve, though there is a mix of positive outcomes and continued challenges, depending on location.
- The Combined Drought Indicator (CDI) shows that approximately 16% of the region remains in one of the drought categories at the end of June.
- June rainfall has been average to below average for the much of the region, while rainfall since the start of the year has been near average.
- The easing of conditions is positive for landholders, with winter farm management decisions critical to longer term improvement.
- Producers continue to monitor conditions closely in conjunction with forecasts and outlooks.
- The DPIRD continues to closely monitor conditions in this region.
Click on the scroll bar below the map to compare with previous months.
Normalised Difference Vegetation Index
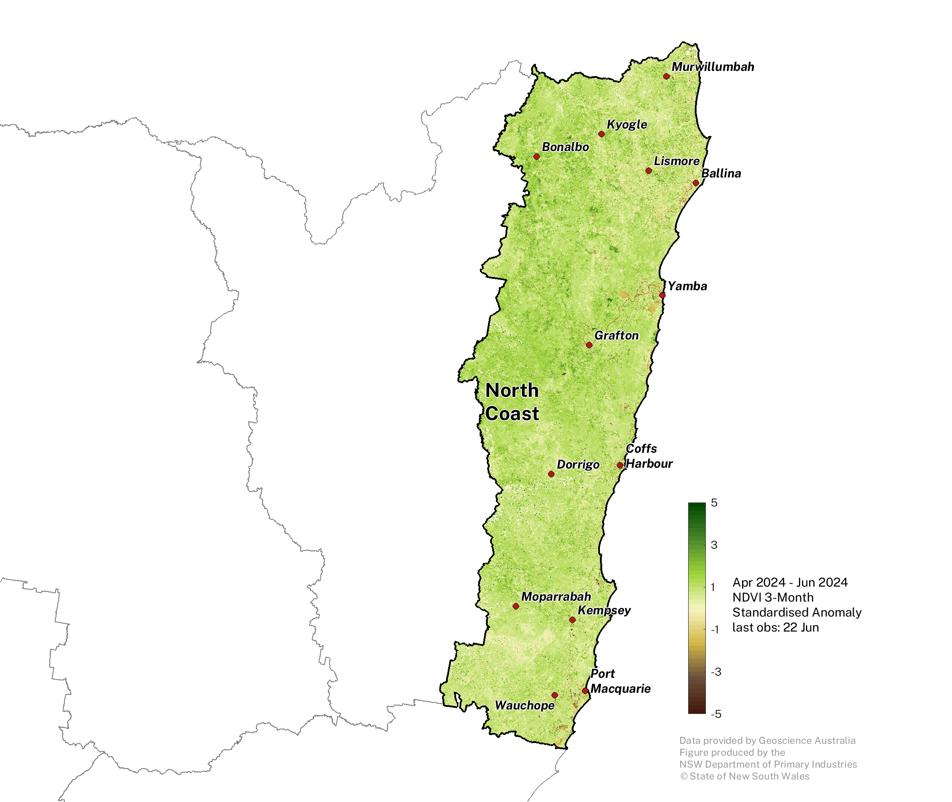
Plant greenness levels remain above average for many parts of the region.
- The NDVI anomaly values have remain generally stable since the last Update. Pasture growth may be slowing and becoming dormant as cooler temperatures are experienced.
- Some of the extremely negative NDVI areas (brown patches) are water bodies.
Click on the scroll bar below the map to compare with previous months.
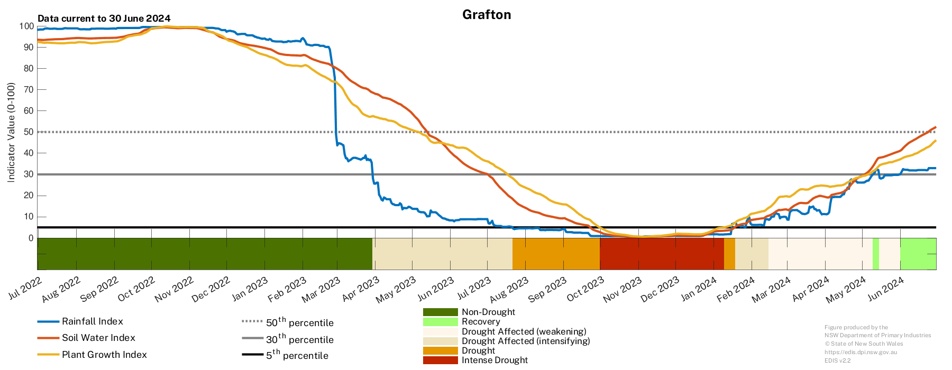
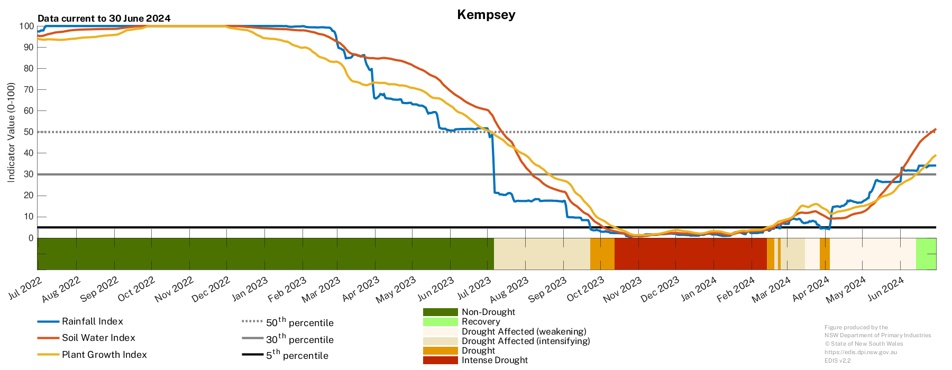
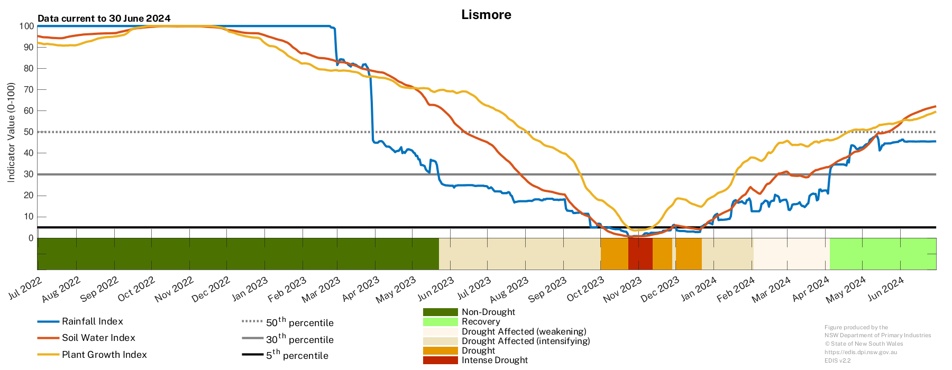
Individual Drought Indicators
The drought indicators continue to improve across all three locations in response to average rainfall totals over the last several months.
- Sustained recovery should continue through winter with further follow up rainfall.
To access a Drought History chart for your Parish, visit the Seasonal Conditions Information Portal.