A NSW Government website

Climate-Smart Fisheries


Oyster production is NSW’s largest aquaculture production valued at over $58M (20/21).  As filter feeders in estuarine environments, oysters are particularly susceptible to extreme climatic events such as flooding and heatwaves.  These events affect production through:

  • Sensor Buoy floating in the Clyde RiverPests and disease impact oyster health causing reduced growth and increase mortality due to air heatwaves and decreased salinity.
  • Possible closures of the fishery due to increased freshwater in the estuary system following extreme rainfall events,  impacting operational efficiency and employee uncertainty.
  • Potential health impact on consumers if appropriate management actions are not undertaken.

The DPIRD Climate team worked with 10 farmers on the Clyde River to research how digital technologies could help producers make informed decisions about changing river and climate conditions.

In 2019, utilising wide area sensor networking infrastructure (LoRaWAN) managed by Eurobodalla Shire Council, the DPIRD Digital Agriculture team built a public sensor network across the Clyde River and has been working extensively with the data to develop new tools to assist the oyster industry. A network of floating sensors developed by the team was placed on buoys in the Clyde River to provide real-time measurements of water salinity and temperature. An automatic weather station (AWS) was also installed on Budd Island in the Clyde River to provide farmers with local real-time weather data. Prior to the installation of the AWS the closest weather station was the BoM site at Moruya Airport, 20km away from Batemans Bay. The AWS provides the oyster farmers with more accurate data that is spatially and temporally relevant to their needs.

A data platform for oyster farmers to access the data using mobile devices has been developed and is being   used by growers to monitor current conditions, how the environment changes seasonally and over time, and to identify favourable water quality for stock placements.

Participating growers were also provided with portable wireless temperature sensors that could be placed and moved with their oysters, allowing them to monitor in-basket temperatures remotely. Oysters are often air-dried to reduce pests and disease, but this action also exposes them to surface air temperatures and heat waves which can prove fatal. The data platform notified growers if temperatures exceed their threshold, allowing them to take action and reduce the effects of the heat wave. While the temperature loggers provided location specific data, the growers found the temperature data from the sensor buoys provided sufficient data for them to make decisions.

The team has been working extensively with the data to develop new tools to assist the oyster industry. The sensor design has been replicated by the University of Technology, Sydney (UTS) and NSW Food Authority across NSW estuaries as part of the oyster monitoring program administering harvest management plans.

Following very positive reviews of the dashboard by farmers and LLS teams the dashboard has recently been extended to cover additional estuaries and made available to a new cohort of oyster growers.

Outcomes from the pilot

Farmers have access to real-time data (figure 1) and learned how to interpret it to understand more about their farming environment and the climatic changes they experienced. The allowed the 10 farmers to make accurate and timely decisions with confidence. This data continues to be used by the farmers and has been expanded to include temperature and salinity data in Port Stephens, the Manning River, and Wallis Lakes.

Table from the FarmDecisionTech Estuary Reports showing the current water conditions in the Clyde River on April 24 at 12pm across the 8 sensor sites. the salinity ranges from 16 - 32ppt, and the temperature is 20 degrees C across all the sites.

Data from the pilot is publicly available and has been shared with organisations such as NSW Food Authority, University of Wollongong, and University of Technology Sydney, allowing them to develop sensors for their own research projects to assist researchers and producers.

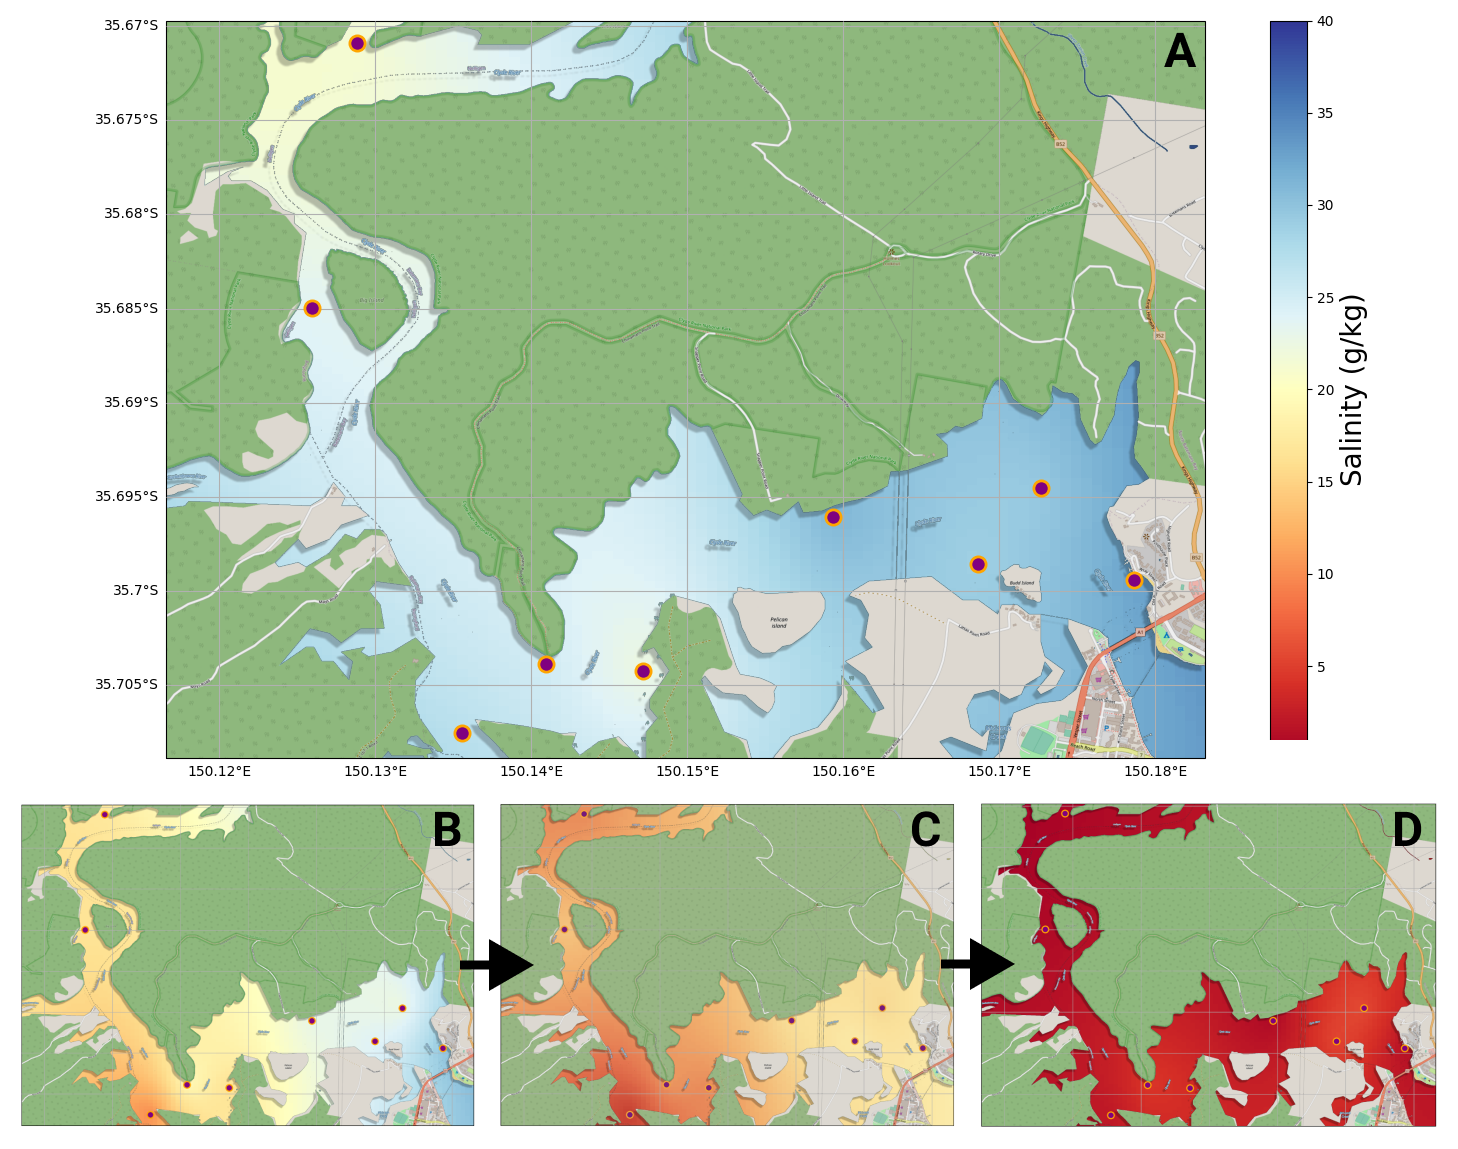
Research is continuing to develop new tools through automated data analysis from these sensors, including animated visualisation (figure 2) of the impacts of extreme rainfall on river salinity over time. The data has also been used to develop a prototype tool to predict when harvest areas will be closed and re-open as a response to extreme rainfall events.  The tool was able to predict over 80% of past closure events, and the length of closure.  Predicting harvest closure and length of closures would allow oyster growers to better manage interruptions from extreme weather events, to use that time productively and plan for down times and allow employees to have improved certainty around disruptions to employment.  More work is required to develop this tool into a production assistant.

Map of the Clyde River that changes colour as the salinity level in the river changes. red (low salinity (0ppt)) - blue (high salinity (40ppt))

Results from this pilot have been published in international journals and presented at local oyster conferences.

References

NSW Department of Primary Industries (2023) Aquaculture production report 2021-2022, NSW DPI, accessed 5 June 2023.


Fisheries Pilot Poster

(PDF, 11980.94 KB)

Kevin and Ewan McAsh - Farmer Stories

Using innovative thinking, the McAsh's have developed a comprehensive management app that revolutionises oyster farming, allowing farmers to more accurately and efficiently keep track of stock.


This work was part of the Primary Industries Climate Change Research Strategy and was funded by the NSW Government’s Climate Change Fund.